Monitoring
The KeySquare platform has been built with monitoring at its core. To that end, KeySquare ships a Grafana instance backed by QuestDB as part of the default stack. KeySquare can be reconfigured to output our telemetry to a different endpoint should you have a preexisting setup that you would like integrated. Please speak to your friendly KeySquare rep should you want to do this.
KeySquare provides both overall platform monitoring and detailed application-level monitoring. Applications using the KeySquare API automatically inherit core monitoring features.
The custom built monitoring API has been purpose designed for low-latency applications and provides the collection and reporting of metrics to provide standardised out-of-the-box monitoring for all applications.
Platform Monitoring
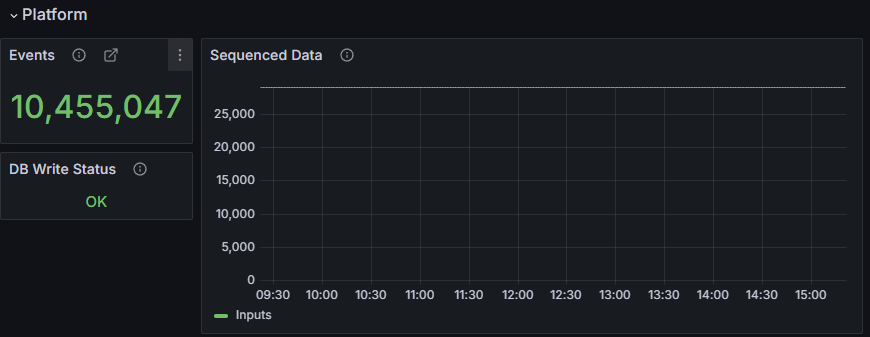
Message counts and rates through the platform
The "Events" count shows the number of messages being sequenced for the selected time period.
The Sequenced Data graph shows the number of messages sequenced over time. Note that the graph shown is for a development environment where test data is being generated at a constant rate.
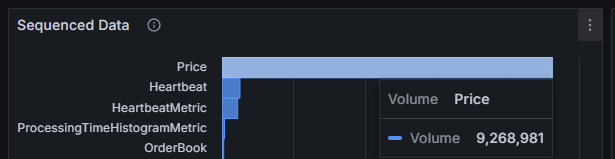
Data Breakdown by Type
Breakdown of data being sequenced by type for the selected time period:
Processing times and latency
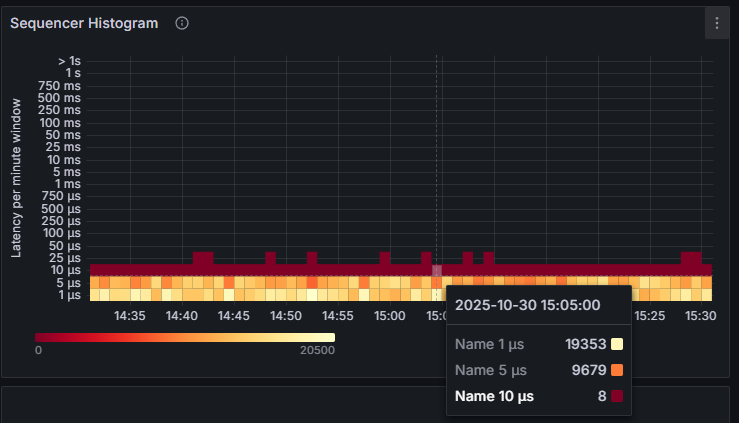
Aggregate processing times of data passing through the sequencer are shown in the histogram below. Each vertical slice represents a one-minute window.
The highlighted slice for the one-minute window of 15:05 is shown below and highlights the following:
- 19,353 events took up to 1μs
- 9,679 events too between 1μs - 5μs
- 8 events took between 5μs - 10μs
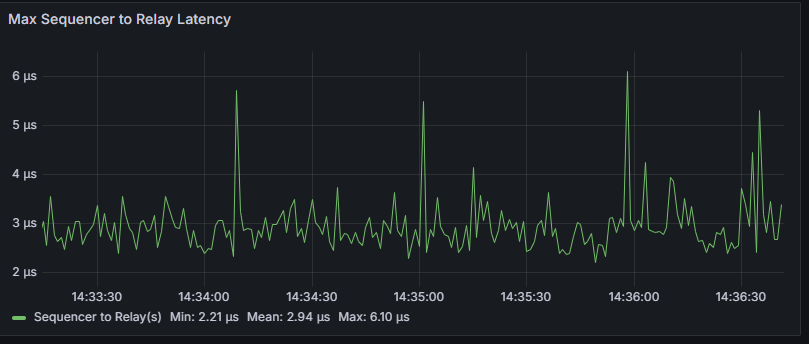
Sequencer to Relay latencies
The time taken for a message to pass from the sequencer to the relay.
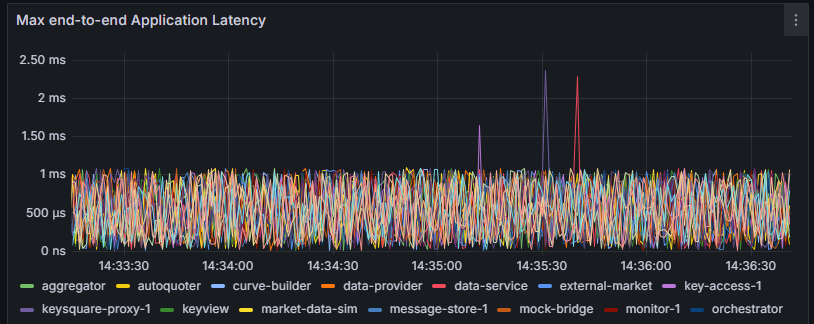
Application to Application latencies
The end-to-end latency application latency measures the time for a message to pass from an application through the platform and back to the application. In the example graph below there is a very clear 0 - 1ms bound, this is a result of the applications in this environment using the SleepingMillisIdleStrategy which can pause application processing time by up to 1ms. Typically end to end times are much lower on tuned hosts where more performant Idle Strategies are used, see ApplicationIdleStrategy
Application Monitoring
Application Metrics
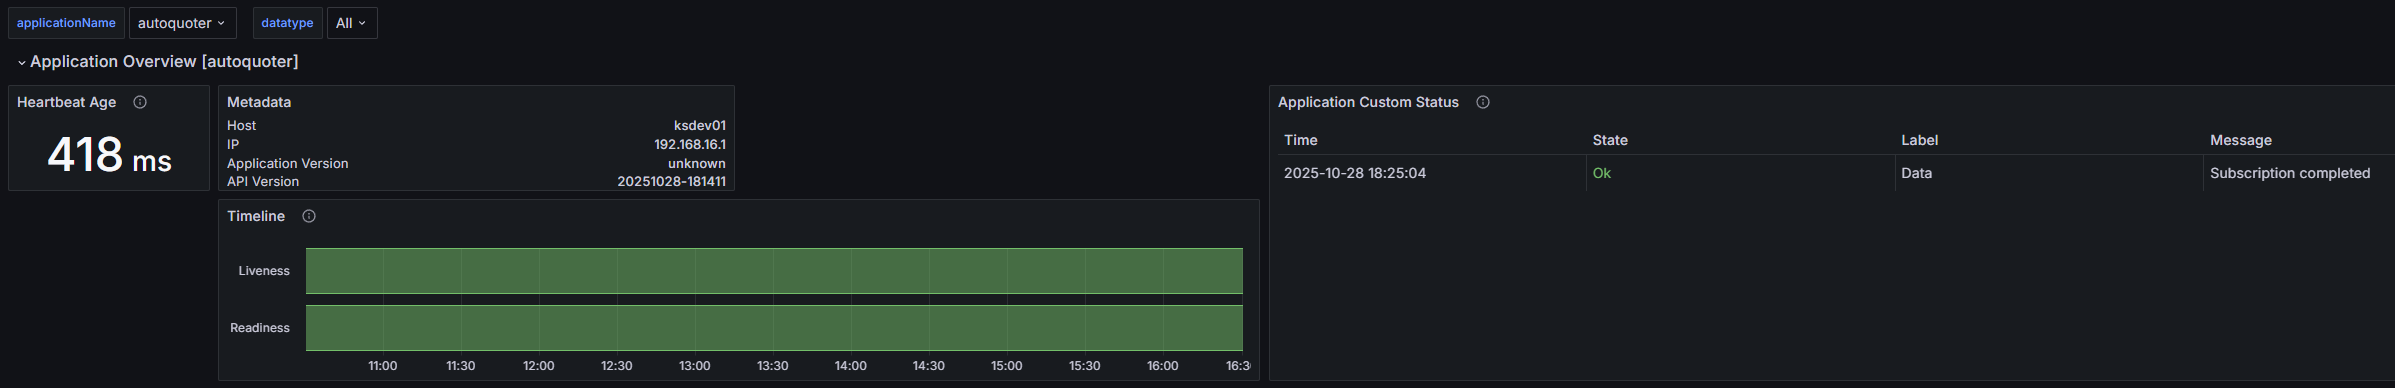
Understanding application status and where applications are in their lifecycles are understandably important for Support to proactively identify issues. KeySquare provides APIs for applications to indicate health back to the platform as well as capturing standardised data.
The following are provided by the API:
- Heartbeat monitoring
- Application metadata such as host, ip and versioning
- Liveness and Readiness monitoring
- Custom application defined status information
- Application internal process times by type
- Application end-to-end latencies
- Transport counters
This will be indicated back to Grafana within an Application's Overview
Application Processing Latency Monitoring
Understanding internal application latencies and understanding if they deviate from performance expectations is a critical part of the support workflow.
KeySquare API users will automatically inherit
- Aggregated application processing time histograms
- Processing time jitter can be indicative of application issues as well as overall tuning
- Data type specific application processing time histograms
- By breaking down by data type, we can better isolate processing time spikes
- End to end latency monitoring going through the critical path
- In our case, this is data from an Application to Sequencer to Relay back to the Application itself
- All KeySquare API applications heartbeat and consume back their own heartbeats to isolate clock sync issues
- Irregularities can be indicative of issues
- In our case, this is data from an Application to Sequencer to Relay back to the Application itself
These are depicted in each Application's Grafana Dashboard
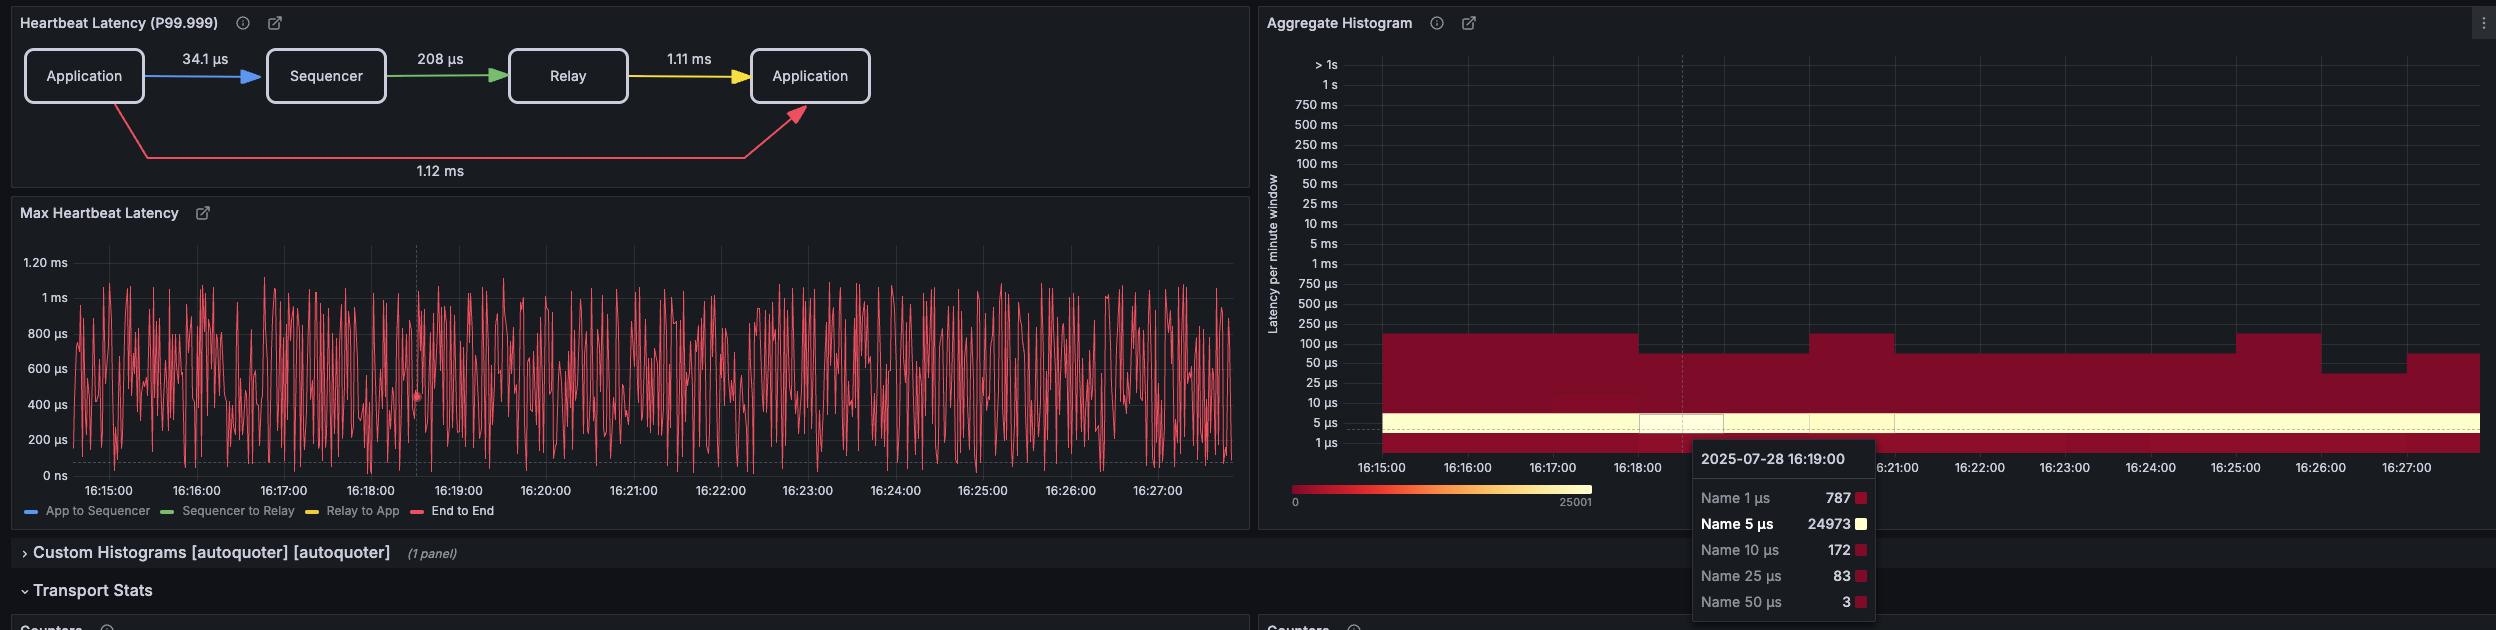
- Heartbeat Latency panel
- This shows the 99.999% (by default; this is configurable) of latency tracked between each hop
- Note, Relay to Application here is relatively high
- This is a good demonstration of the different idle strategies that can be configured per application
- The default idle strategy is SleepingMillisIdleStrategy with 1ms (which this application is using here)
- The Sequencer is using a BusySpinIdleStrategy here on an isolated CPU core hence Application to Sequencer 99.999% latency of 31.6us
- This is a good demonstration of the different idle strategies that can be configured per application
- Max Heartbeat Latency panel
- This shows the four latencies over time matching the Heartbeat Latency panel
- Note, Relay to Application is relatively high and spikey due to the configured idle strategy in this application. See ApplicationIdleStrategy configuration in KeySessionListener.
- Aggregate Histogram
- This shows the processing durations for incoming events over time
Application Data Rate Monitoring
On a per application basis, monitoring exposes:
- Aggregated input event counts and rate graphs over time
- Aggregated output event counts and rate graphs over time
- Data type specific input event counts
- Data type specific output event counts (coming soon)
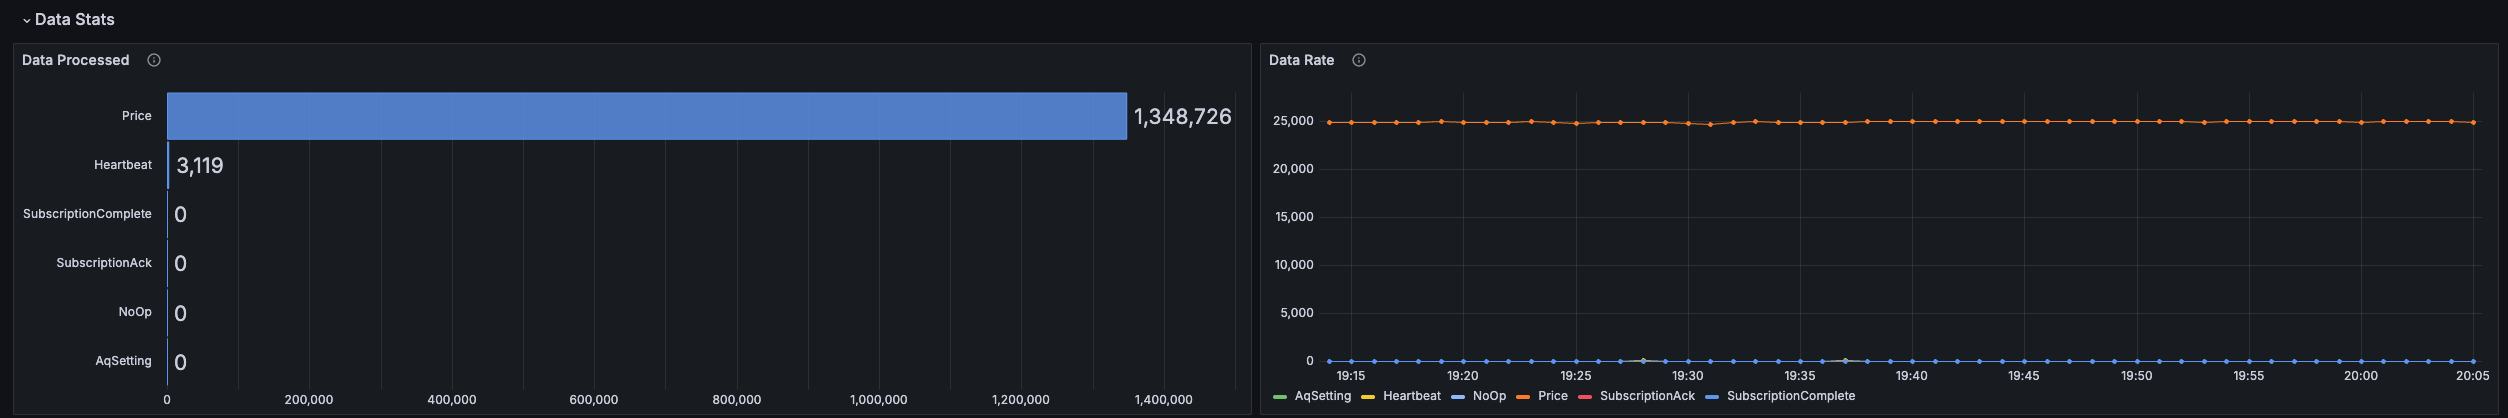
This screenshot shows for the configured Grafana period:
- Event counts per data type
- Data rates over time broken down by data type
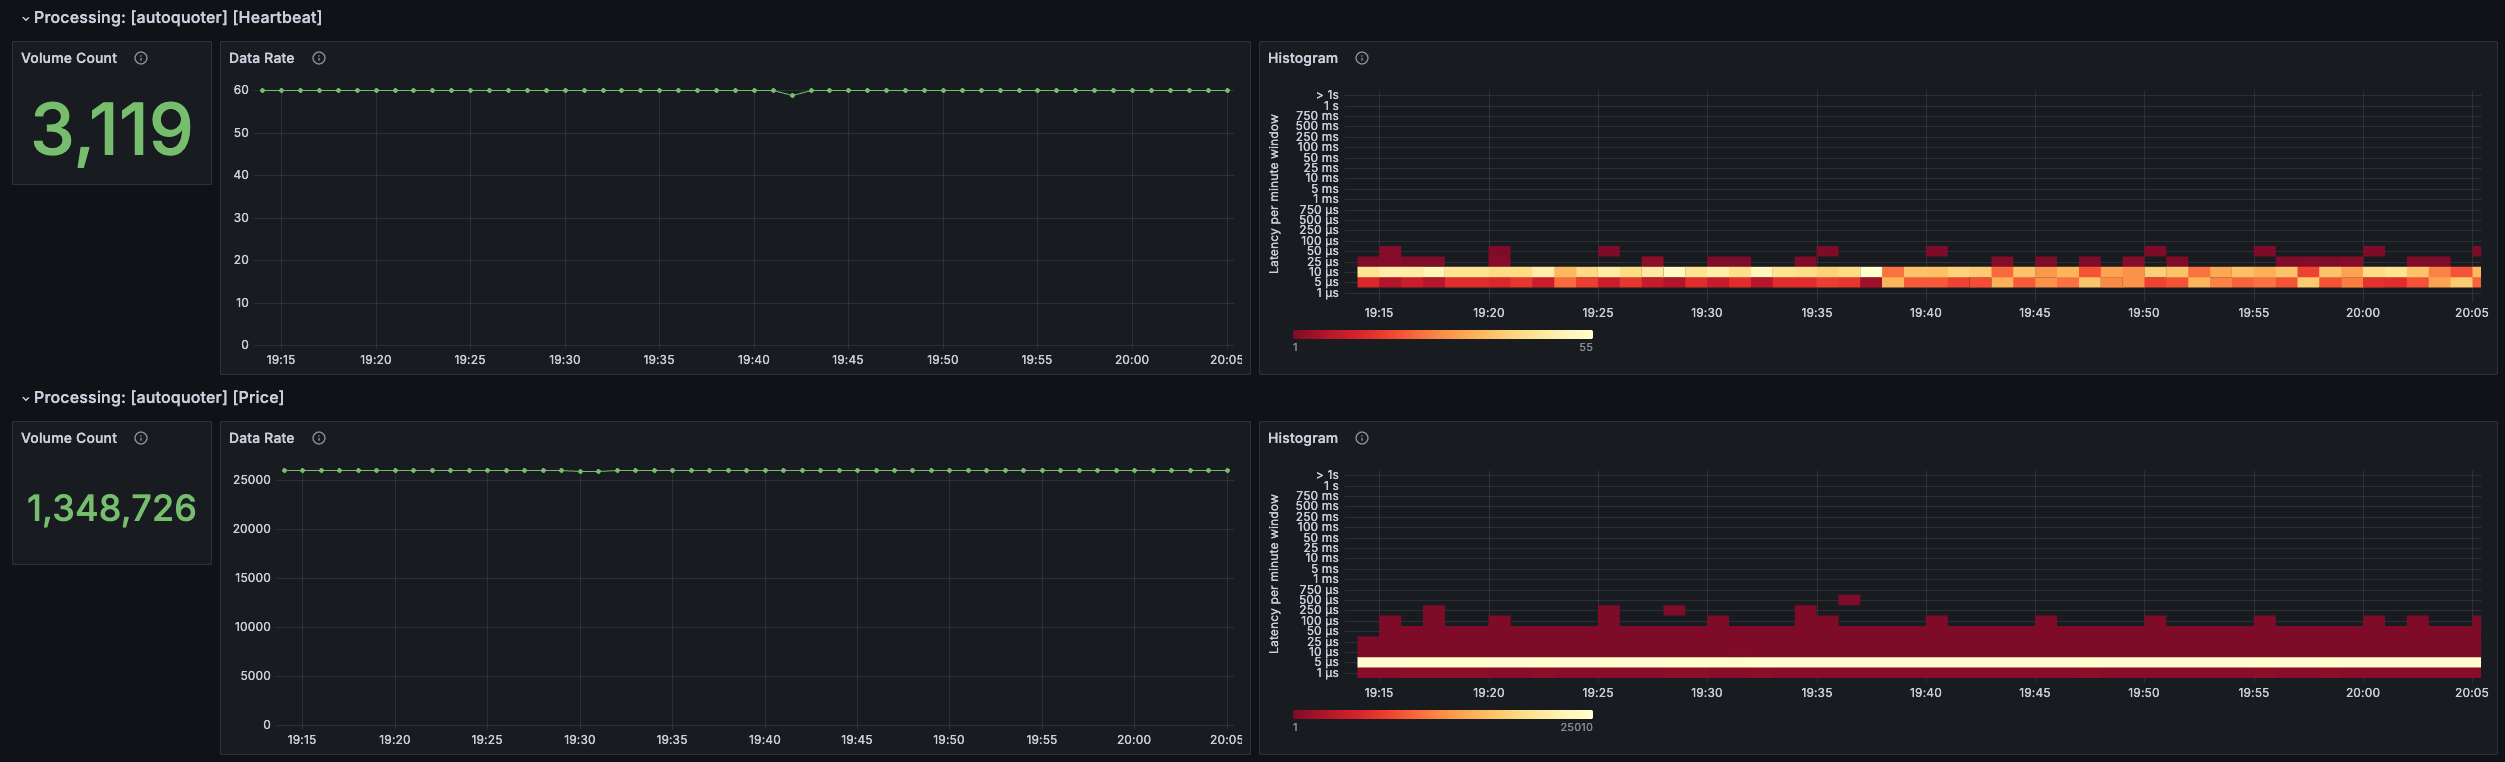
- Data rates over time broken down by data type
- Processing duration histogram over time
Custom Application Defined Monitoring
The API supports the ability for applications to define their own Histograms and Counters which will automatically be captured and provided in Grafana.